- Improved search function and new API - 25.10.2023
The search function of OpenRailwayMap uses from now on a new implementation.
When searching for stations, previously only the
name=*tag of OpenStreetMap was taken into account. From now on, all variants of thename=* tag, i.e. shortened, official and foreign-language names are used.In the past, the string entered in the search field had to match the beginning of the name of the object. Instead, the new search uses a full-text index. Skipping the prefix of a station name (suburban stations without the name of the city, e.g. Nomentana instead of Roma Nomentana) will not prevent the station from appearing in the search results.
Sort order of results is now based on the estimated relevance of the train station which is calculated from the number of public transport route relations using the station. It is based on the assumption that more important stations are served by more public transport route relations in OpenStreetMap.
The search for milestones on railway lines was reimplemented as well. Both search functions use pre-processed database tables and additional indexes in order to be more efficient and provide faster search responses.
The documentation and the source code of the API the search function is based on can be found on GitHub.
- OpenRailwayMap auf der IT-Trans - 28.02.2018
From 6. to 8. of March, the IT-Trans will take place in Karlsruhe, Germany, an international conference and exhibition for intelligent solutions for public transport.
Since its first show in 2008, IT-Trans has been one of the world's leading events for the digitisation of public transport. Every second year the whole world of public transport, from multinational enterprises over small and medium sized businesses to aspiring startup companies, meets here.
On March 6, the OpenRailwayMap will be showcased at booth D12 together with geOps. Project founder Alexander Matheisen will be there all day to introduce the project and answer questions.
- Enabling HTTPS - 21.01.2018
Now it is possible to access our website, tiles, API and mailing list using HTTPS.
Users who already embed our tiles or request our API in their HTTPS website will not get mixed content errors any more. And for users who have been prevented from using OpenRailwayMap content in their HTTPS-delivered website, there's no reason not to do so.
- Train protection systems - 16.02.2016
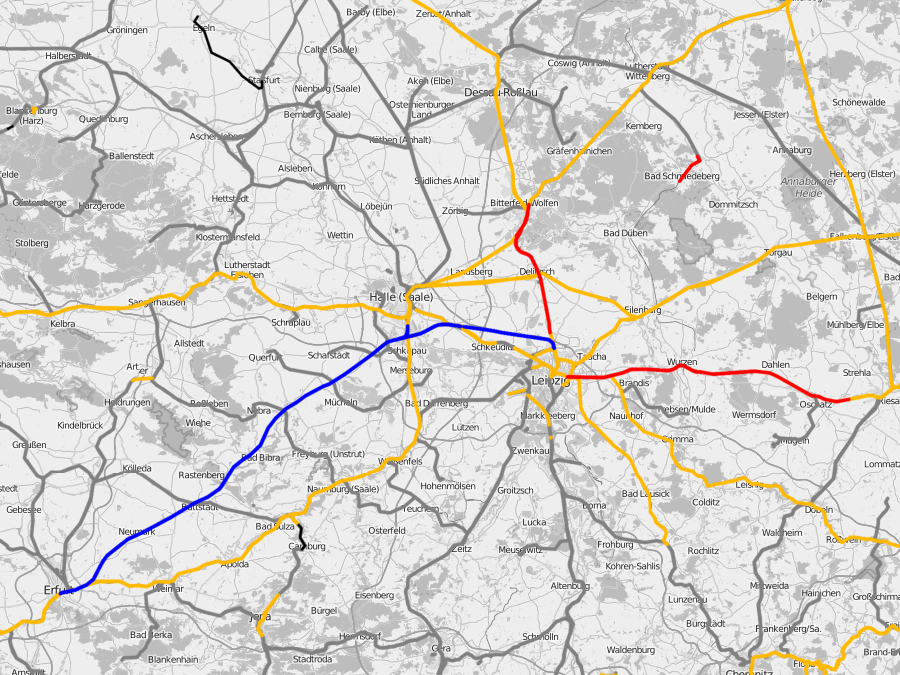
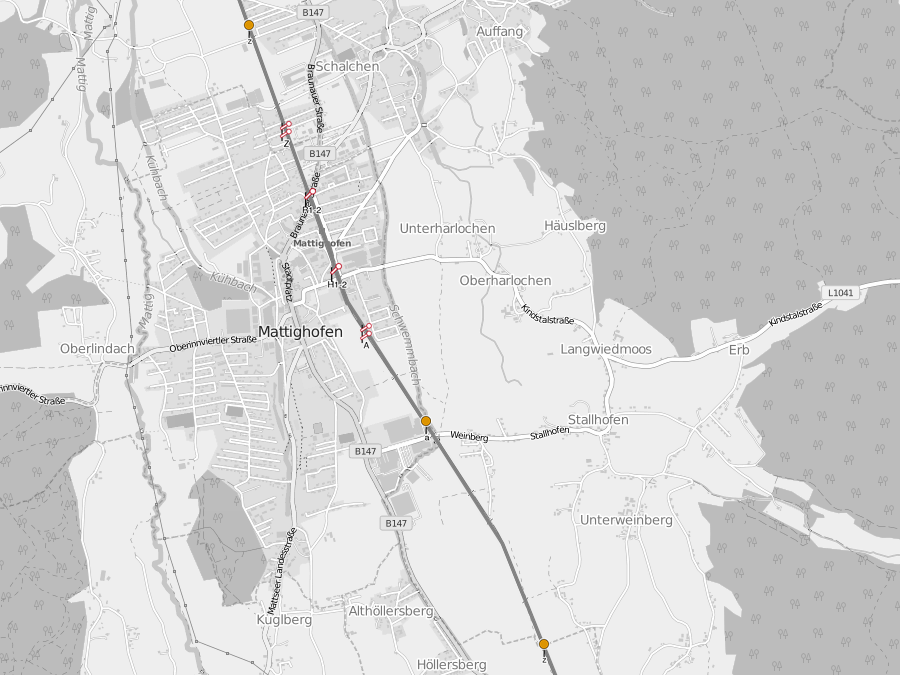
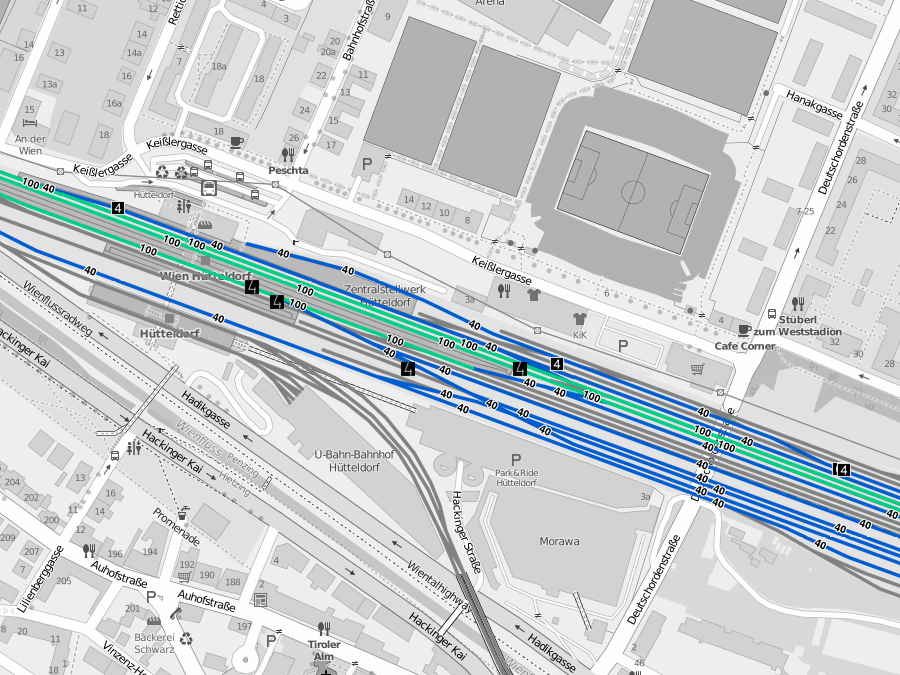
Train protection systems are now rendered in signalling layer. For the beginning, the three most important systems used in Germany and Austria are visualized: The intermittent train protection system "Punkförmige Zugbeeinflussung (PZB)" in orange, the continuous system "Linienzugbeeinflussung (LZB)" in red and the European Train Control System (ETCS) in blue. Railroad tracks without train protection are rendered in black while those without any information are rendered as grey lines. Train protection systems of other countries will be added in future.
- Some more Austrian signals - 03.01.2016
Some mapper may have already noticed the following changes. Anyway, here is an "official" presentation of the changes concerning Austrian signals: After a significant number of Austrian railway signals was rendered since mid october, some users followed our appeal and contributed some more signal icons. Many thanks!
Austrian main and distant signals in form of light signals were already rendered, but now the map also visualizes the semaphore equivalents of these signals.
- Deutsche Bahn and Open-Data - 03.11.2015
"Deutsche Bahn (Germany's national railway company) opens its datasets." A joke? No, such times seem to be past now. DB will launch its own open data portal soon.
If you expect DB to publish hundreds of datasets, you might be disappointed. But please note that such a large corporation cannot turn from "secret" to "open and free" within a few months. DB itself has to gain experience with open data, especially licensing and technical matters. As a beginning, DB will publish a few datasets as appetizers – a list of the shortings of all stations (according to DB guideline no. 100) and informations about the elevators at its stations. Luckily, DB choosed CC-BY as license.
Open Knowledge Foundation Germany comments it this way: "It seems as the times when the community could get the data of Germany's largest railway corporation only via ingenious hacks or by collecting the data on their own and risked adhortatory letters like OpenPlanB three years ago." We would like to note that the way DB reacted (Google Translate) on the publication of its timetable CD (called "HAFAS-CD") without DB's consent was very friendly. We think that the aim to put pressure onto the DB was missed. It is not surprising that DB has abstained from opening its dataset for the last three years. Publishing the conversation software (OpenPlanB did this, too) without the data would not have been such spectacular but legal.
As OpenStreetMap contributors we use different and legal methods to steer authorities and companies towards open data – crowdsourcing. We want to achieve the same OpenStreetMap already has already achieved on common geospatial data: Breaking the monopoly of the old monopolists/oligopolist like surveying authorities, Here, TomTom etc. The open data hostility and high data usage fees of German surveying authorities and their controlling authorities has been helping us very much. Surveying authorities did not and do not want to give up their revenues by usage fees and forece price and quality sensitive users to use OSM data. The blank map attracted lots of contributors over the first years and nowadays countries which have been more hostile against open data have the larger and more active communities than countries which have been more open-data-friendly.
The same now happens with railway infrastructure data. Because DB did not publish any useful data, a handful of volunteers started to map the German railway infrastructure on their own.
There is an interest in such data. If you sort all requests of OpenRailwayMap since January 2015 by providers, DB is at rank 5 (10 % of all requests of openrailwaymap.org), only Telekom, Vodafone, Kabel Deutschland (Cable Germany) and Telefonica (O2) are ahead. We have talked to some employees of DB. They told that its common nowadays at some parts of DB to use OpenRailwayMap as an addition information source to get an overview over an area or station. OpenRailwayMap offers are map DB does not offer its staff. In addition, DB's geospatial applications usually have an GUI which was designed in 1990s or early 2000s and has not been refurbished any more while OpenRailwayMap uses state-of-the-art web mapping frameworks.
We have asked DB several times for the last three years to make data available. We only got negative or no answers. That's why we are pleased with DB asking the community if a cooperation would be possible.
Open data does not only benefit the general public. DB benefits most. If open data would not benefit DB itself, DB could not publish data for free due to a loss of revenues of usage fees. Currently, its normal business at DB that one part of DB is paying large amounts to buy geospatial data from another part of DB – or just using OSM because it is free. Open data will reduce the work spent in buying and paying geospatial data and will lower hurdles for creative employees.
We are happy that DB does first steps into the cold open data water but we do not erupt with jubilation. The aim of OpenRailwayMap has still not been reached yet. First, DB will only publish a few small datasets and, second, companies and authorities cannot arrange a dataset which covers multiple topics and fulfills multiple needs at once. OSM contains not only railway tracks and roads but also landuse, buildings and points of interest. Data users get the data from a single source and only have to comply with one license.
If you want to put a giant into movement, you shold not claim but do crowdsourcing on your own. Instead of asking for dataset of punctuality or access to Zugradar and timetable API, you could collect the current positions of trains by crowdsourcing. The resulting dataset would be free of third parties' rights and not suffer from the limitations (Google Translate 1, 2) of DB' systems. It would take some time until there will be enough data (you won't get all trains because some run nearly empty through Germany) and first applications will arise (and attention by railway fans and railway staff, too). Power comes from knowledge and knowledge from data.
There is one mistake in Stefan's and Walter's posting. They write that the "times of crowdsourced data collection [as a replacement for missing open data]" are over now. Unfortunately, that's still wrong. DB is Germany's most important railway infrastructure operator but there are other companies which operate the other 18 % of Germany's railway infrastructure. To call some examples without any judgement: Regiobahn, AVG, SWEG and Deutsche Regionaleisenbahn, not to mention all the railway infrastructure operators outside Germany. Even if all railway infrastructure operators would publish all their data, OpenRailwayMap and the railway data at OpenStreetMap will not become redundant. We serve the function to collect, improve and maintain railway data. Our aim is to create an independent data source. The OpenStreetMap project has proofed that a separate dataset can be accurate and more up to date than other datasets.
- Expanded visualization of Austrian and German signals - 28.10.2015
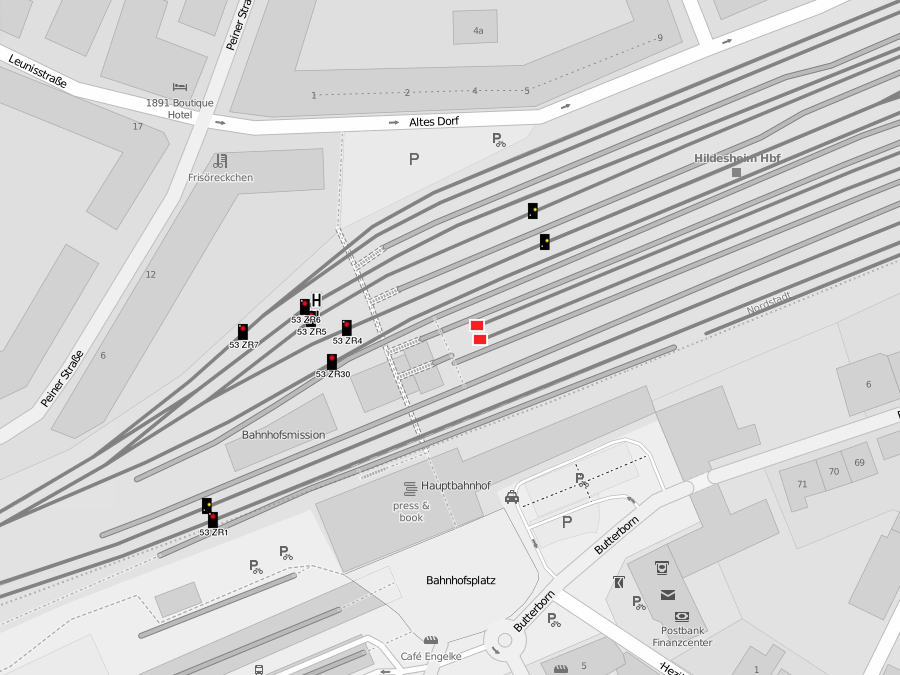
For several day OpenRailwayMap visualizes a significant number of Austrian railway signals. Austrian signals are not completely new on the map. Austrian signals which look identical to their German equivalents, such as 'Trapeztafeln', have already been rendered on the map. Now we added light main and distant signals as the most important Austrian-specific signals.
We also added various Austrian speed and distant speed signals to the map. Currently only signs up to 120 km/h are rendered; for light signals we need to create appropriate icons (SVG icons licensed under Public Domain or CC-0 are welcome). These signals are already mapped in some places such as Vienna. We hope that the visualization of this first selection of Austrian signals will encourage mappers to map more signals.
Auch die German light speed signals (Zs 3) and speed limit signals (Zs 3v) were added. Previously only the signs of those signals were displayed, not the light signal version. The icons shows the highest speed value that a signal can show, but at maximum 120 km/h. There may be some signals also displaying higher speed limits (e.g. 150 km/h), but there are currently no icons for these states. To avoid a messed up map in densely mapped stations, those signals are rendered in zoom level 1+ instead of 16+.
There are also some new icons on German branch lines. We added the speed limit signs "Eckentafel" (Lf 5, only Eastern Germany), the white "Anfangstafel" (Lf 5, only Western Germany) and "Geschwindigkeitstafel" (Lf 4, only Western Germany).
This work was done while the OpenStreetMap Hack Weekend at the office of Geofabrik in Karlsruhe, Germany on 17. and 18. October 2015. We also spent some more work on the redesign of the OpenRailwayMap website, which will offer a responsive design for a better experience on mobile devices. There is still a lot of work to do until the release of the new website. We thank Geofabrik for hosting this hack weekend.
All images in this blog post contain OpenStreetMap data (© OpenStreetMap contributors) and are available under the terms of CC-BY-SA 2.0 OpenRailwayMap and OpenStreetMap.
- Use OpenRailwayMap on your mobile device with OsmAnd - 11.06.2015
Using OpenRailwayMap on mobile devices is now easier: OsmAnd, an app running on Andriod and iOS devices, offers integrated support for OpenRailwayMap. You can easily add the different layers of OpenRailwayMap as overlays. Have a look at the wiki howto.
Now you can use features that the mobile website cannot offer: The alignment of the map in any direction or the visualization of your own position. Also very interesting is the possibility to combine the railway overlay with any other background map, such as aerial imagery. However, there is one limitation: The overlays are loaded dynamically, which requires an internet connection. Offline usage would be nice to have, but is currently not implemented due to some problems:
The generation of ready-to-use downloadable offline maps requires more server resources and bandwidth that are currently not available. There won't be a solution for this problem soon, but the open data of OpenStreetMap allows users to generate offline maps on their own. The necessary steps are documented in the OSM wiki.
Currently, however, there is the problem that the existing OpenRailwayMap stylesheet, written in MapCSS cannot be used due to an specal OsmAnd format. Writing stylesheets for OsmAnd means a lot of work, in particular the continuous synchronization with the MapCSS files requires some effort. Developing a tool for converting MapCSS stylesheets to the OsmAnd format would be one approach to avoid a lot of manual work and make life easier. That would also ensure that both online and offline maps look almost identically. For both tasks, supporters, who are interested in using OpenRailwayMap on mobile devices, are welcome.
- The Karlsruhe hack weekend and what else happend since January - 28.04.2015
Even if there was no new blog article in the last few months, the development has not stopped. We are happy to welcome Eike (Dakon) as a new developer in our team.
Since the FOSSGIS Hack Weekend in January, the signalling layer was extended by several German and Austrian signals. Now it shows distant sign("Kreuztafel"), shunting stop signs ("Rangierhalttafel" / "Verschubhalttafel") and shunting signs ("Wartezeichen" / "Wartesignale"). The advantage of these three signals is that they are almost equal in Germany and Austria, so that we can use the same icons. The German signals were extended by block marker signs ("Blockkennzeichen"), repeated or shortened light signals type Ks and combined signals type Sv. The maxspeed layer now also shows disused and construction tracks, which are rendered in lighter colours to make them distinguishable from active railroads. In infrastructure layer, bridge and tunnel names tagged with bridge:name and tunnel:name are favoured over track names. Bridges and tunnels at tracks such as monorails, which are not traditional railroads, are not rendered any more. In the past this caused unexpected results on the map.
In the meantime, Eike improved the rendering of signal boxes and moved them to the more appropriate signalling layer. Signal boxes are now rendered in green with names. Some bugfixes at node-tileserver were necessary to render signal boxes tagged as buildings. The infrastructure layer now also visualizes turntables and traversers.
To improve the data quality, more validation rules for JOSM were added. These new rules check e.g. whether track numbers are tagged correctly and not as names or if signals have logical tagging issues. Features are also checked for various deprecated and not supported tags.
There were some changes of the JOSM presets, too: Items for platform section signals ("Zugdeckungssignal"), ETCS stop signs (Ne 14) and some new icons were added to the German preset. The signals were retagged with the new country-operator-prefixes. Tagging changes, that were decided at the meetings in Cologne and Bad Nauheim, were applied to some items. There were also some bugfixes of syntax errors and translations to English.
There are also some new features on the website: Users can view the railway overlay without any basemap. The search now also finds spur junctions tagged as railway=spur_junction. Kudret Emre added a Turkish translation of the website, thanks a lot!
Some new features such as icons for crossings in infrastructure layer, rendering of track numbers, German distant signs with shortened braking distance, German light speed limit signals and catenary signals (in Germany and Austria) are still under construction.
We thank Geofabrik from Karlsruhe for hosting the OSM Hack Weekend in February, where Alex and Michael implemented a part of the new features mentioned above.
Beside finishing the pending changes, improvements of the legend, updates and additions of the translations and a redesign of the website stand on our todo list. The signalling layer will be continously extended by Austrian and Dutch signals. The search will be improved, so that it returns also disused, abandoned, constructed and proposed stations. Tracks used for tourism or military purposes, which are currently not rendered on the map, will be visualized, too.
- FOSSGIS Hack Weekend at Linuxhotel in Essen - 15.01.2015
Last weekend (January 9–11, 2015) Alexander (rurseekatze) and Michael (Nakaner) stayed at FOSSGIS Hack Weekend at Linuxhotel in Essen, Germany. FOSSGIS e.V. is quasi, but not official OpenStreetMap Foundation Local Chapter in Germany and funds free software/projects around GIS software and OpenStreetMap. Linuxhotel is a hotel only for Linux and open source software training. At weekends, open source software communities can stay there for cheap prices.
While Alex created a JOSM preset for Austrian railways this weekend, Michael did a couple of smaller fixes and improvements. He added German crossing signals (Bü 0/1), the Sv signals of Hamburg Light Rail ("S-Bahn") and an icon for Sh 2 signs. He replaced icons of Ks signals by new ones. To be able to differ between Hp 0 ("stop") of Ks system and other systems which have a red light, he decided to change the meanings of the Ks icons. Hp 0 (red light at the top of the signal) now represents a Ks combined signal (prior Hp 0 represented a Ks main signal). Ks 1 (green light in the center) represents a Ks main signal (prior Ks 1 represented Ks combined signals). Ks 2 (yellow light at the right) represents a Ks distance signal (prior Ks 2 represented Ks combined signals).
Michael also improved the infrastructure style. OpenRailwayMap now renders tunnel and bridge names which are tagged using tunnel:name=* and bridge:name=*. Trams will be rendered at zoom level 10+ now and industrial tracks won't be as thick is usual.
As requested in a couple of bug reports, Michael improved maxspeed style. From now on, speed limits of disused and being constructed tracks will be rendered, too. We will not render speed limits of abandoned or proposed tracks.
Since two weeks, the tracks in the signalling layer are rendered as grey lines for a better orientation.
Note that these changes still need to be deployed on the webserver and are not visible on the homepage yet. This will be done soon.
We thank FOSSGIS for offering this location and event to improve OpenRailwayMap and look forward to the next FOSSGIS Hack Weekend. The next hacking event with participation of OpenRailwayMap will be the Hackweekend im Februar in der Geofabrik in Karlsruhe.
- German Hl Signals - 29.12.2014
Hl signals are main and combined light signals used by 'Deutsche Reichsbahn' (predecessor of 'Deutsche Bahn' in the German Democratic Republic). OpenRailwayMap now renders them (example).
It took a while to implement this signal system because it has a lot of different views it can show. Hl signals have two signal functions in one signal. The upper two lights show which signal the train driver has to expect. The middle red light is used for Hp 0 (formerly known as Hl 13), its replacement light is located at the lower right. The lower left light is yellow and turned on if the signals shows a reduced speed. This is 40 km/h by default and can be increased by a yellow (60 km/h) or green (100 km/h) bar below the signal.
But now back to map. Icons at OpenRailwayMap should show which signals the signal can show. With H/V semaphore and light signals we introduced the convention that a signal showing stop (red light) means that we do not have information about its possible signals.
Block signals can only show Hl 1, Hl 10 and Hl 13 (i.e. they cannot show Hl 2, Hl 3a and Hl 3b. They are rendered as Hl 1 (green light if signal has no distant signal function) or Hl 10 (if the signal is combined signal).
If the signal cannot show a green or yellow bar, it is rendered as Hl 3a¹ (green light at the top, yellow light below)/Hl 12a² (both lights yellow).
If the signal has a light bar but can only show a yellow one (green lights missing), the signals is rendered as Hl 3b¹ (green light at the top, yellow below, yellow bar at the bottom)/Hl 12b² (both single lights yellow, yellow bar below).
If the signal has two light bars, the signals is rendered as Hl 2¹ (green light at the top, yellow below, green bar at the bottom)/Hl 11² (both single lights yellow, green bar below).
Hl signals which are only distant signals (not main or combined signals) are rendered as Hl 1 with sign Ne 2 (distant signal sign).
Apart from two exotic German signals sytems – Sk and Sv system, we now have all signal systems used in Germany at OpenRailwayMap. If you want to see your local signal system, provide us following information:
- a German or English description of your signal system (we will suggest you a tagging scheme based on it)
- suitable signal icons as SVG files
- suggestions for rendering rules (you do not have to provide MapCSS)
¹ signals which are not distant signals, too
² combined signals
- Database update problems resolved - 09.12.2014
Since last friday, the data updates are running again without problems, after it had been no or only irregular updates for the last several weeks.
Unfortunately, the update process could not be switched to the Augmented Diffs of the Overpass API as intended, because the format is currently not appropriate for our purposes, so we keep the current toolchain. The required space was created by changing the RAID level of the two SSDs. Instead of being configured as RAID-1, they are now configured as RAID-0, which offers twice the storage space and a slightly higher performance at no additional costs.
The only disadvantage of this solution is the higher risk of data loss in cases of disk failures. In my opinion this problem is not that important, as there are only a few data which are not also stored anywhere else. This data can also easily be saved periodically on another computer and restored after a total failure and the following reinstallation of the system.
However, an additional conventional hard disk for the server would be desirable to make full backups of the system comfortably and to restore the system in case of failure. But it costs extra money again...
- OpenRailwayMap Meeting in Bad Nauheim, Germany - 03.11.2014
The second OpenRailwayMap Meeting took place at user spth's home in Bad Nauheim near Frankfurt (Main) on 24 to 26 October 2014. It was a extension to the first "Mapping Weekend" in Cologne in July. Tagging discussions, which had been skipped due to a lack of time (or too much topics), and new tagging related questions and proposals were discussed now.
The two other attendees, Michael (Nakaner) and Alex (rurseekatze), used their journey there to map. Michael went a detour by train from Karlsruhe over Heilbronn and Hessian Odenwald Railway and mapped their using GPS waypoints. Alex filmed between Düsseldorf and Cologne as long as his ICE was not too fast.
You can find the detailled protocol at OpenStreetMap Wiki. The most important topics were:
A discussion in German OpenStreetMap Forum made us to discuss differentiation between heavy railwas, light railway lines, trams and subways on Friday evening. We also discussed the tag railway=narrow_gauge. We think that this tag is an outdated synonym for railway=rail. We think that change these tagging in OSM database is useless.
If tracks are interlaced, we suggest to map all tracks as separate OSM ways and to tag these ways with railway:interlaced=yes. If passing is prohibited between two tracks, you can now use railway:passing_prohibited=left/right/yes/both.
The tagging discussions were continued on Saturday morning. Contrary to the rule not to tag ways both with usage=* and service=*, we decided that usage=* and service=* should be allowed for industrial siding and yard tracks to be able to differ between industrial and normal siding/yard tracks in rendering.
We defined new tags for meter load and axle load – meter_load=* and axle_load=*.
We could not reach a settlement in the question how to use maxspeed=* if there are different speed limits for different types of vehicles (e.g. trains with and without ability to tilt in curves or vehicles with/without eddy current break).
If a power line is mounted on catenary masts, you can now tag the mast with power=catenary_mast. This tag can also be used for the masts of trolleybusses and electric ships. We also invented new tags for power supply into catenary, jumpering of separators of catenary, the ground level power supply of Bordeaux tram, crossing boxes, blockposts and sidings.
On Saturday afternoon we went outside to map along the railway lines to Gambach and Gießen.
Because mappers have been using railway=owner_change, different form designation, for owner changes (e.g. between a national railway company and a private company), we decided to introduce railway=border for owner changes near country borders.
We also invented tags for automatically rising roadway barricades on Russian level crossings and in UK used gates on level crossings. If a level crossing has a saltire, it now can be tagged as crossing:saltire=yes. The new key crossing:supervision=* describes how railway personell takes care that no vehicles remain behind closed boom gates. This can be happen by a level crossing attendant, camera or radar scanners. We also decided to introduce a new tag for the time between closure and reopening of a level crossing.
On Sunday we invented signals for German trams and Berlin subway. This made us changing tagging of LZB signals. Now every signal which is related to a train protection system should be tagged as railway:signal:train_protection=*.
Just before the end, we created tags for some facilities which can be found in depots like sand stores and drinking water supply.
On the retourn journey, Michael and Alex mapped, too. Michael filmed between Friedberg and Frankfurt (Main) and between Frankfurt (Main) and Weinheim-Lützelsachsen until it became too dark outside and the phone battery became empty. Alex filmed West Rhine Railway between Mainz and Koblenz until as long as it was bright enough.
- Karlsruhe Hack Weekend - 20.10.2014
Although most of the strike of Gewerkschaft der Lokomotivführer (German Train Drivers' Trade Union) last weekend, Alexander Matheisen (rurseekatze) came to OpenStreetMap Hack Weekend at Geofabrik in Karlsruhe, Germany. Together with Michael Reichert (Nakaner), he continued work on OpenRailwayMap's map styles.
Now all tracks without a maxspeed tag are rendered as grey lines, so that the map does not look so gappy any more. Tracks are only rendered at that zoom levels they would be rendered in infrastructure style. That's why the blue lines of trams and siding tracks will not mar the map at low zoom levels any more. Roads with railway tracks (e.g. abandoned railways which are now used as roads) will not be rendered in maxspeed style. Rendering of disused and abandoned tracks has been removed from maxspeed style but we ponder to add rendering of railway lines which are under construction or disused in a brighter colour.
A large bunch of changes happened to the signalling layer. It now renders a lot of German main and distant signals (all H/V distant signals and H/V semaphore main signals) with new icons. We also added icons for whistle and ring signs, entry signals of stations on branch lines ([Ne1](https://en.wikipedia.org/wiki/German_railway_signalling#Ne1_Trapeztafel)), halt distant signal (Ne6).
Michael has drawn icons of Hl signalling system of former Deutsche Reichsbahn of GDR, shunting signals and crossing distant signals. They will be added soon.
All these icons are from Michael's collection railway-signals. He had to modify some of them for OpenRailwayMap due to the small size of the icons (e.g. semaphore signals, Hp light main signals, crossing distant signals).
Another attendee of Karlsruhe Hack Weekend had a surprise for us in store. Arndt Breschede, developer of Android bicycle router BRouter (web interface, Google Play), has written a very simple routing profile for trains. At the moment it calculates routes over everything which has rails, regardless if this is a train track or a tram track. It uses opposite track of two-tracked railway lines, too. If you have time, you can extend this profile. You can test own routing profiles at BRouter-Web by entering your profile content in the text field at the left bottom. One nice feature of BRouter is the ability to define no-go areas. We might integrate a router based on this application into OpenRailwayMap website in future.
Diffent than originally planned, Alex could not do some mapping on West Rhine Railway on his way home because the EC 6 replacement train was overcrowed and he could not get a seat next to the window.
- Validation of railway data with JOSM - 07.10.2014
I have often seen various tagging mistakes while mapping railroads. Some day I experienced that JOSM offers a possibility to extend the built-in validator by MapCSS-like rules and thought "hey, wouldn't it be great to use this for a railroad-data-validator?".
Now I have started such a validation file for JOSM. [2] It includes a first selection of a few typical tagging issues, but I still have a very long list of more issues and will add them step by step.
Every railroad mapper may have experienced typcial tagging mistakes, too. It would be nice if more mappers could add some rules. The easiest way would be pull requests, but suggestions by email are also good.
- German speed signals almost complete - 31.07.2014
Since yesterday, almost all german speed signals are rendered on the map. Switching to the maxspeed layer, there are already lots of mapped signals visible on the map. Zs 3(v) light signals are not rendered yet due to a difficult visualization of the different possible signal values. There are already ideas on how to visualize there signals. Signals of temporary speed restrictions ("Langsamfahrstelle") (Lf 1/2 and 1-5) are currently missing, too. Since temporary speed restrictions are usually not mapped in OpenStreetMap, this is not a major disadvantage.
A demo area, where almost every speed signal is mapped, can be found here. The rendering of the signals on the map should motivate mappers to map even more of these signals.
Soon we will add more signal icons to the signalling layer and replace existing symbols by nicer icons.
- Looking back at the OpenRailwayMap Mapping Weekend - 14.07.2014
The first OpenRailwayMap Mapping Weekend (with tagging discussion) took place in Cologne, Germany from 11 to 13 July 2014. It was a knowledge and communion exchange between the railway infrastructure mappers in Germany. We discussed about extensions and changes of the railway tagging scheme. Mentz Datenverarbeitung was represented by Emrah Kutlu.
At Friday evening the attendees arrived at the event location, Lokal K, and we got to know each other. We talked about public relations work for OpenRailwayMap and how to get new mappers (especially people who are no mappers at the moment but interested in trains and railways). Afterwards everyone presented his mapping techniques.
On Saturday morning we first had a breakfast at Lokal K which faded to a presentation of OSM-related work of Mentz Datenverarbeitung, a company form Munich, developing software for public transport companies, by Emrah.
He presented their experiments to route over the German railway network and the routing errors they found. We explained him the tags service=*, usage=* and maxspeed=*. We realized that there is a demand for tagging the normal direction of traffic of railway tracks to improve routing. The normal direction of traffic is the direction into trains usually use a railway track. This is the right track at double-track lines in Germany, it is the left track in other countries (e.g. UK, France, Switzerland). If there is the possibility to change the track on a double-track line before and after a curve, the routing algorithm might use the inner (opposite) track of the curve even if the train would block this track for trains of opposite direction. That's trains usually avoid usage of the opposite track.
At Saturday afternoon we paused discussions and went outdoor to map. Consti, Alex, Michael, and Emrah went by train from Köln West to Euskirchen. Emrah left the event there because he had to travel back to the airport, the other ones journeyed on to Bad Münstereifel and afterwards back to Cologne via Euskirchen.
The train from Cologne to Euskirchen was an older diesel trainset class 628. Due to the lack of GPS reception (apart from the door window and the gaiter we could just do simple video and photo mapping without georeferencing although the railway line is not electrified after Hürth-Kalscheuren. In Euskirchen we changed into a local train to Bad Münstereifel. The railway line to Bad Münstereifel is a not-electrified branch line. In Bad Münstereifel we stayed in the train and travelled back to Euskirchen. This rail ride took place in a modern Talent 1 diesel trainset which had a very good GPS reception at every place inside the train. That's why it was possible to take a lot of geotagged photos. Alex took photos of almost every signal and Consti indulged his passion of mapping ticket vending machines and their reference numbers for his [ticket vending machine map]((https://osm.lyrk.de/fahrkartenautomaten/#12/50.6083/6.8071). During change of direction at Bad Münstereifel the train driver was friendly and let the curtain of back cabin open so that we could take photos into the back direction.
In Euskirchen we did not use the Regionalexpress (express train) to Cologne but the slower and 30 minutes later departing local train to Cologne. In the meantime we mapped Euskirchen station using photomapping. Alex took photos using his 70–300 mm telephoto lens especially signals, signal numbers and more distant objects, I took overview photos using a 18–105 mm lens. The station building and the station forecourt were mapped, too.
Euskirchen train station is getting new Ks light signals (see the German Wikipedia article for images) and an electronic signalbox at the moment. Not all new signals are mounted at the moment but we decided only to map the newer ones because the older ones won't stay there longer than a few months. The results of our mapping tour to Euskirchen and Bad Münstereifel are not uploaded to OpenStreetMap at the moment. This will take place soon.
After arrival at Lokal K we continued tagging discussions. At about 8.00 p.m. jotpe, a local mapper from Cologne, joined us. Around midnight we stopped tagging discussion and went back to our flat to sleep.
Consti and Peter departed directly from the flat the next morning. Alex and Michael went to Lokal K where they met user spth from Frankfurt. They discussed a lot of open tagging issues, e.g. the ORM opinion if train stations (the station at whole, not the building) should be mapped as areas or nodes. We decided to change a few railway infrastructure tags which are used little at the moment and whose key or value names had been chosen badly. The tagging discussion took until 5.30 p.m.
The protocol can be found at OpenStreetMap wiki. The German version covers everything, the summarizing English version only the tagging discussion) and a few other parts.
The Lokal K is very suitable for meetings like this. We would like to thank the Cologne Wikipedia community for their hospitality and recommend it hereby. If it had a shower you could also sleep there (on the floor).
We plan a second meeting to discuss all issues we have not finally decided yet. This meeting will take place more centrally in Germany or in the Frankfurt area.
- New translations and updates - 25.06.2014
The website at openrailwaymap.org is now also available in Dutch, French, Portugese, Swedish and Ukrainian.
There were also updates of the Czech, German, Spanish, Polish, Russian and Vietnamese translations, which added missing strings and corrected some errors.
- First mapping event - 18.05.2014
The community of railway mappers within OSM is getting bigger and the project OpenRailwayMap is expanding continously. Therefore, it is now time to get to know one another.
Therefore we are planning a mapping event, whose aim is to map a poorly covered area as completely as possible. To do this, we would go out in small groups to travel railways lines and explore smaller areas by foot. After this we would continue with entering the collected data and the social part of this event.
Currently we are still in the planning phase and clarify when and where the event will take place. The current state of planning and more information can be found in the OSM Wiki and in a voting.
We need enough participants, so that such an event can take place.
- Improved rendering of maxspeeds - 04.05.2014
After an style update, not just values in steps of 5 km/h, but any speed value is considered for the rendering of the maxspeed layer. The previous rendering style caused that lines with different speed values were not drawn on the map. Primarily lines in the UK, where the maxspeed values were tagged in km/h instead of mph (the conversion produced odd values), were affected by this problem.
- OpenRailwayMap on Twitter - 02.05.2014
The OpenRailwayMap is now represented with its own account on Twitter. There you will find information about new features of OpenRailwayMap, railroad mapping and interesting places on the map.
- Mobile website - 23.04.2014
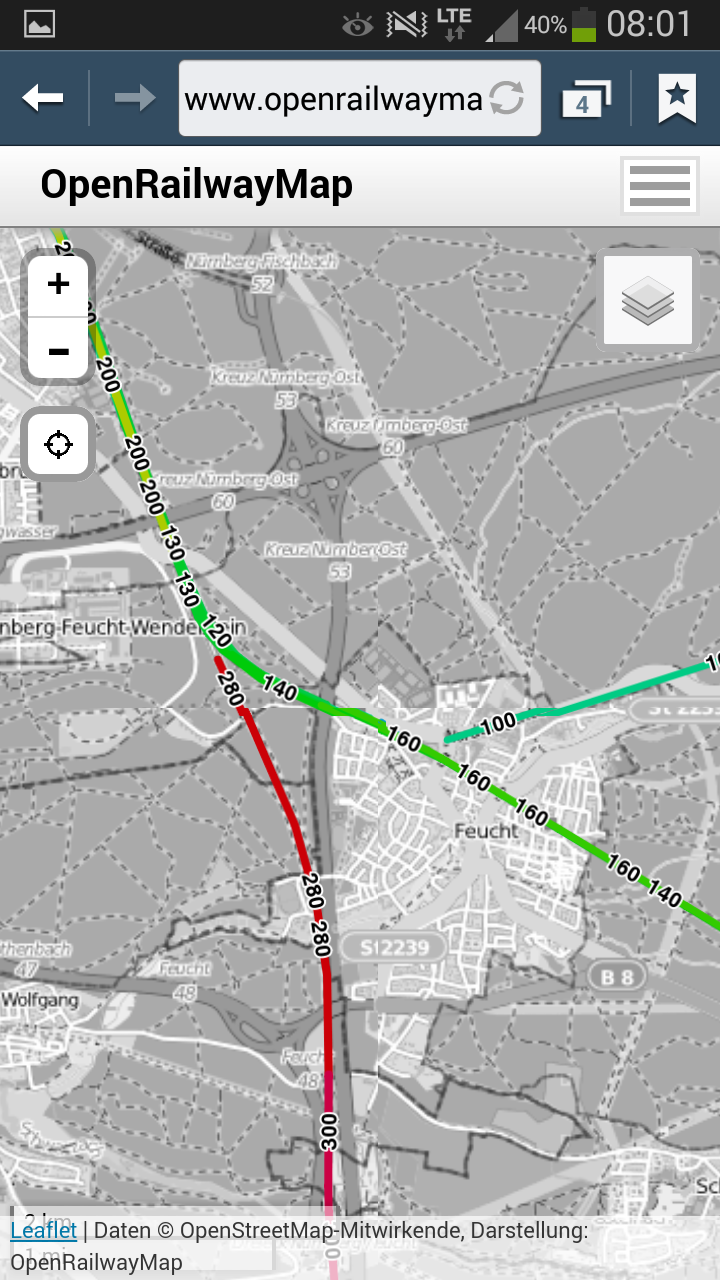
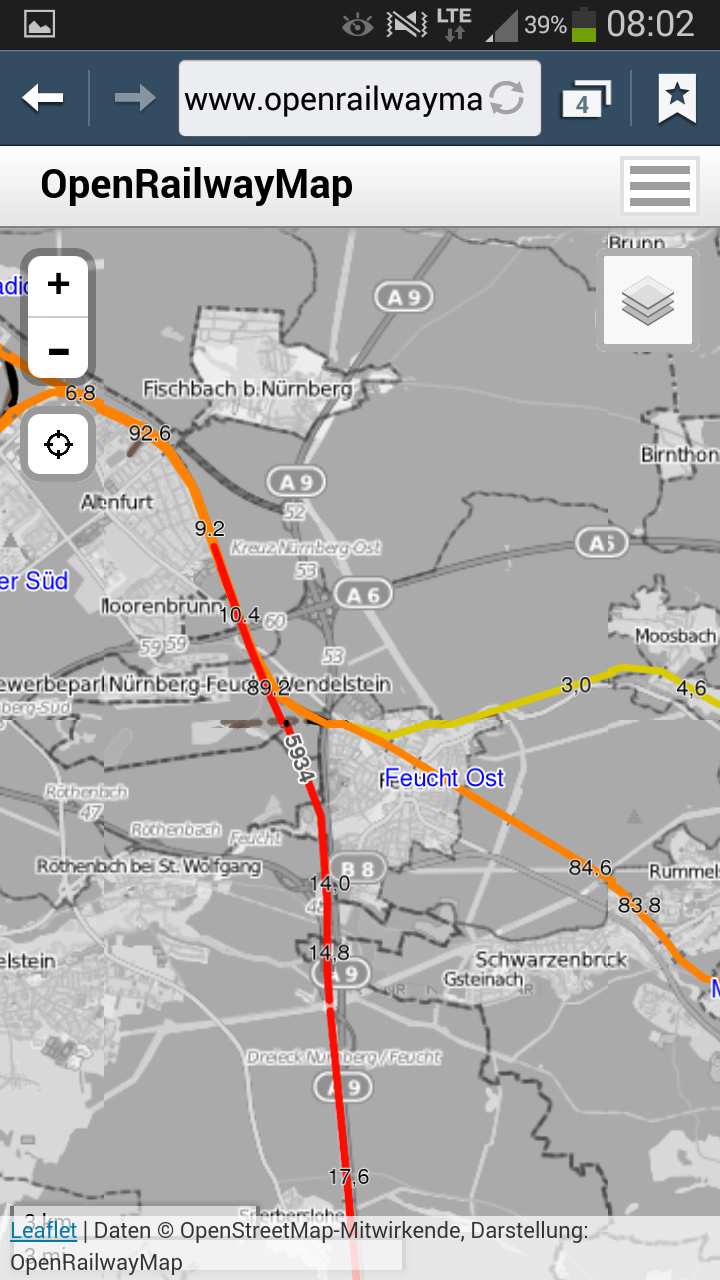
It is now easier to use the OpenRailwayMap on smartphones and tablets: By visiting openrailwaymap.org from a mobile device, the user is automatically redirected to a mobile version. Opening m.openrailwaymap.org forces the mobile site even on a desktop computer.
The mobile website is - apart from the background map - fully adapted to Retina displays.
Provided you have an internet connection, it is as easy as never before to use OpenRailwayMap on the go. With the ability to get the own position by Geolocation API, it is possible to follow the train's location on the map. Even the question whether the train you are sitting in is currently standing in front of a block signal can be answered easily.
- Restructered signal tagging scheme - 13.04.2014
The tagging scheme of the signals has been reorganized: The general tagging scheme has been freed from coutry-specific information in the range of signals, therefore pages for country-specific tagging information have been created. This is easier to understand and avoids mixing of international and country-specific tagging rules. Gradually, this division is to be implemented for the entire tagging scheme.
- English translation of the tagging scheme - 13.04.2014
Since there is also an increasing number of railway-interested mappers from the non-German-speaking countries, it is now overdue to translate the tagging scheme also into English.
As a copy of the German page, the English version of the tagging scheme was created a few days ago.
For a single person the translation of this large site is not possible in the foreseeable future. Therefore, I would appreciate help with the translation. This does not only help other mappers, but also me - if I do not have to deal with the translation, I can focus my work on the technical development. The more people help, the faster the translation is completed.
- New translations and updates - 06.04.2014
The website at openrailwaymap.org is now also available in Danish, Polish, Russian and Spanish.
There were also updates of the Czech, English, German, Greek, N'ko, Slovenian and Vietnamese translations, which added missing strings and corrected some errors.
- Improved rendering of signals - 19.03.2014
The rendering of signal icons on the map has been improved. Previously many signals were visible only at high zoom levels because they overlapped with neighboring icons. This phenomenon occurred especially in larger stations with a high density of data. This confused the users, because not every mapped signal was visible and the renderer decided randomly, which signals are displayed and which not.
This behavior has now been corrected, so that all mapped signals are drawn on the map. Some signals may overlap with neighboring signals, but it is now directly visible to the user, how complete the data.
In addition, some improvements have been made to avoid cutted icons at tile edges.
Note: The changes will be visible on the map only after an automatic rerendering of the tiles.
- Rendering of line names - 08.03.2014
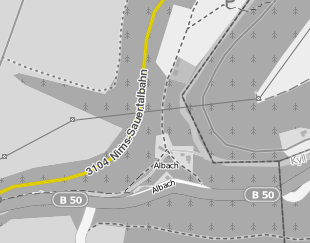
The rendering of line names tagged with name=* was added to the map style.
Note: The changes will be visible on the map only after an automatic rerendering of the tiles.
- Improved rendering of maxspeeds - 04.03.2014
The rendering of the track speeds has been improved so that just the tagged maxspeed value influences the rendering order. That means that high-speed lines are rendered on the top of lowspeed lines if they collide with each other. Till now, the tags tunnel=*, bridge=* and layer=* were considered for the rendering order, which, however, caused unexpected rendering results because a high-speed line in a tunnel was covered by a lowspeed line despite their higher speed. Now these are ignored by the renderer in maxspeed layer.
Note: The changes will be visible on the map only after an automatic rerendering of the tiles.
- Serverupgrade - 25.02.2014
We have successfully moved to a more powerful server. The growing amounts of data, the increasing number of website visitors and many new features required this.
The new server has the following hardware features:
- 2x 240 GB SSD
- 16 GB RAM
- 1x Xeon Quadcore 2,4 GHz
This means a significant performance increase over the previous server that had the following hardware features:
- 1x 80 GB HDD
- 2 GB RAM
- 1x Dualcore CPU 2,4 GHz
Thus, the map and the search function should feel a bit smoother now, but above all, the server is now relieved significantly. However, some fine tuning of the database is also necessary to take full advantage of the new hardware.
- Mailing list - 23.02.2014
For all railway mappers, users and developers of OpenRailwayMap, a new mailing list is now available.
- RSS-Feed available now - 28.04.2013
This is the official RSS feed of the OpenRailwayMap. You will find news about new features and the process of development soon.
